
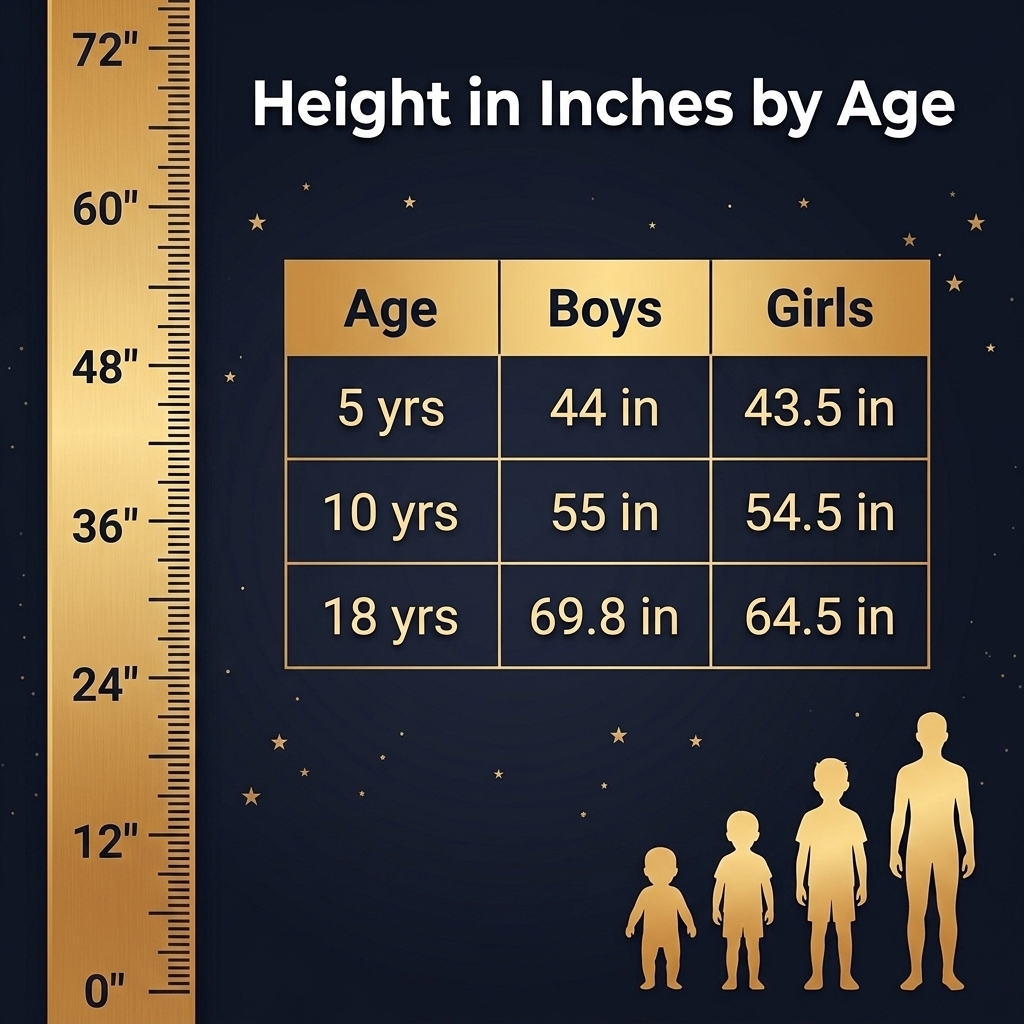
Height in Inches by Age: Complete Charts for Boys, Girls & Adults
You checked the internet for your child’s height and got a number without context. Is 44 inches at age 5 fine? What about 60 inches at age 12? Without knowing what “normal” looks like at each stage, a raw measurement tells you almost nothing. This guide gives you the complete average height in inches by age — from newborns through older adults — so every number you measure has a reference point.
Quick Answer: Average Height in Inches by Age (50th Percentile)
The tables below show the median height (50th percentile) for boys and girls at each age, based on CDC growth chart data and WHO standards. Half of all children at each age fall above these numbers; half fall below. Both are normal.
Boys: Average Height in Inches by Age (Birth to 18)
| Age | Average Height (Inches) | Average Height (ft/in) |
|---|---|---|
| Birth | 19.7 in | 1′ 7.7″ |
| 3 months | 24.0 in | 2′ 0.0″ |
| 6 months | 26.5 in | 2′ 2.5″ |
| 9 months | 28.3 in | 2′ 4.3″ |
| 1 year | 30.0 in | 2′ 6.0″ |
| 18 months | 32.4 in | 2′ 8.4″ |
| 2 years | 35.0 in | 2′ 11.0″ |
| 3 years | 38.0 in | 3′ 2.0″ |
| 4 years | 41.0 in | 3′ 5.0″ |
| 5 years | 44.0 in | 3′ 8.0″ |
| 6 years | 46.0 in | 3′ 10.0″ |
| 7 years | 48.0 in | 4′ 0.0″ |
| 8 years | 51.0 in | 4′ 3.0″ |
| 9 years | 53.0 in | 4′ 5.0″ |
| 10 years | 55.0 in | 4′ 7.0″ |
| 11 years | 57.0 in | 4′ 9.0″ |
| 12 years | 59.5 in | 4′ 11.5″ |
| 13 years | 62.0 in | 5′ 2.0″ |
| 14 years | 65.0 in | 5′ 5.0″ |
| 15 years | 67.0 in | 5′ 7.0″ |
| 16 years | 68.5 in | 5′ 8.5″ |
| 17 years | 69.5 in | 5′ 9.5″ |
| 18 years | 69.8 in | 5′ 9.8″ |
Girls: Average Height in Inches by Age (Birth to 18)
| Age | Average Height (Inches) | Average Height (ft/in) |
|---|---|---|
| Birth | 19.4 in | 1′ 7.4″ |
| 3 months | 23.6 in | 1′ 11.6″ |
| 6 months | 25.9 in | 2′ 1.9″ |
| 9 months | 27.8 in | 2′ 3.8″ |
| 1 year | 29.5 in | 2′ 5.5″ |
| 18 months | 31.8 in | 2′ 7.8″ |
| 2 years | 34.5 in | 2′ 10.5″ |
| 3 years | 37.5 in | 3′ 1.5″ |
| 4 years | 40.5 in | 3′ 4.5″ |
| 5 years | 43.5 in | 3′ 7.5″ |
| 6 years | 45.5 in | 3′ 9.5″ |
| 7 years | 47.5 in | 3′ 11.5″ |
| 8 years | 50.5 in | 4′ 2.5″ |
| 9 years | 52.5 in | 4′ 4.5″ |
| 10 years | 54.5 in | 4′ 6.5″ |
| 11 years | 56.5 in | 4′ 8.5″ |
| 12 years | 59.5 in | 4′ 11.5″ |
| 13 years | 62.0 in | 5′ 2.0″ |
| 14 years | 63.5 in | 5′ 3.5″ |
| 15 years | 64.0 in | 5′ 4.0″ |
| 16 years | 64.5 in | 5′ 4.5″ |
| 17 years | 64.5 in | 5′ 4.5″ |
| 18 years | 64.5 in | 5′ 4.5″ |
Source: Data adapted from CDC Growth Charts (2–20 years) and WHO Child Growth Standards (birth–2 years).
Pro Tip: These numbers represent the median — the midpoint. A child at the 25th or 75th percentile is not short or tall; they are following a healthy growth curve. What matters most is consistency along one percentile line over time, not the specific number itself.
Adults: Average Height in Inches by Age Group
Height does not hold steady across all adult decades. NHANES (National Health and Nutrition Examination Survey) data shows a gradual decline starting around age 50, driven partly by spinal disc compression, bone density changes, and postural shifts.
| Age Group | Men — Average Height (in) | Women — Average Height (in) |
|---|---|---|
| 20–29 | 69.2 in (5′ 9.2″) | 64.3 in (5′ 4.3″) |
| 30–39 | 69.4 in (5′ 9.4″) | 64.3 in (5′ 4.3″) |
| 40–49 | 69.4 in (5′ 9.4″) | 63.6 in (5′ 3.6″) |
| 50–59 | 69.0 in (5′ 9.0″) | 62.8 in (5′ 2.8″) |
| 60–69 | 68.7 in (5′ 8.7″) | 62.3 in (5′ 2.3″) |
| 70–79 | 68.1 in (5′ 8.1″) | 62.3 in (5′ 2.3″) |
Source: CDC NHANES data (measured height, not self-reported).
Adults typically lose 0.5 to 1 inch per decade after age 40. If you lose more than 2 inches from your peak adult height, that warrants a conversation with your doctor — it can signal vertebral compression fractures or osteoporosis.
Compare your measurement against average height data by country and gender on our dedicated page.
How Height in Inches Changes at Each Life Stage
Understanding the pattern of growth is as important as knowing the numbers. Growth is not a steady upward line — it happens in waves, then plateaus, then declines.
Infancy (Birth to 12 Months): The Fastest Year
The first year of life is the most explosive growth period a person ever experiences. Most babies grow approximately 10 inches (25 cm) in their first 12 months.
- Birth: ~19.4–19.7 inches
- 6 months: ~25.6–26.5 inches (gain of ~6 inches)
- 12 months: ~29–30 inches (gain of another ~4 inches)
Infants are measured lying down (recumbent length) rather than standing. This measurement reads approximately 0.7 cm longer than an equivalent standing height — completely normal, and the reason growth charts treat 0–2 year measurements separately.
Toddlers (1 to 3 Years): Slowing but Steady
Growth rate drops sharply after the first birthday. Expect gains of:
- Year 2: ~4–5 inches
- Year 3: ~3–4 inches
By age 3, most boys are around 38 inches and most girls around 37.5 inches. Pediatricians often use the doubling rule as a rough check: a child’s height at age 2 is roughly half their eventual adult height.
Childhood (4 to 10 Years): The Predictable Years
This stretch is the most consistent growth period. Most children gain a reliable 2–2.5 inches per year from age 4 through early puberty. Growth is symmetric — boys and girls track at nearly the same rate until around age 10.
Use our Height Charts to see where your child’s measurements sit against CDC percentile curves.
Puberty (11 to 18 Years): The Growth Spurt Window
Puberty is where individual variation gets significant. The timing of a growth spurt matters as much as the spurt itself.
Girls typically experience their peak growth velocity at age 11–12, gaining up to 3.5 inches in one year. Most girls reach their adult height by age 14–15.
Boys hit their peak growth velocity later — usually ages 13–14 — with gains of 3–4 inches in a single year. Most boys stop growing by age 17–18, though some continue adding a fraction of an inch into their early 20s.
| Stage | Boys Peak Spurt | Girls Peak Spurt |
|---|---|---|
| Timing | Ages 13–14 | Ages 11–12 |
| Gain per year (peak) | 3–4 inches | 3–3.5 inches |
| Adult height reached | ~17–18 years | ~14–15 years |
A child who starts puberty earlier will typically finish their growth earlier, too. Late bloomers often catch up — and sometimes surpass — their peers by their late teens.
Young Adulthood (18 to 25): Final Plateau
Growth plates (epiphyseal plates) close by the late teens for most people. Once they close, height gain stops. Very rarely, someone adds a marginal amount of height into their early 20s. By 25, your height is essentially fixed.
This is the best time to establish your baseline adult height with an accurate measurement. See our guide on how to measure height accurately at home for the exact method.
Middle Age and Beyond (40+): The Gradual Decline
Height loss in adults is real and measurable. It happens for three main reasons:
- Spinal disc compression: Discs thin and lose hydration over decades
- Postural changes: Muscle weakness leads to mild spinal curvature
- Bone density loss: Particularly pronounced in postmenopausal women
The average adult loses roughly 0.5 inches per decade starting around age 40. Women tend to lose more than men, partly because of accelerated bone loss after menopause.
Pro Tip: Track your height annually from age 40 onward. Use the same time of day (morning gives the tallest reading), same wall, and the same measurement method for accurate comparisons year over year. Any loss of more than 2 inches from your peak height warrants medical evaluation.
What “Height in Inches” Actually Means
Before diving into comparisons, it helps to anchor what these numbers represent in the unit itself.
One inch = 2.54 centimeters. A child who measures 44 inches is 4 feet tall exactly. An adult at 69 inches stands 5 feet 9 inches — the median height for American men.
Use this quick reference for the most common conversions:
| Height in Inches | Height in Feet & Inches | Height in CM |
|---|---|---|
| 24 in | 2′ 0″ | 61.0 cm |
| 36 in | 3′ 0″ | 91.4 cm |
| 48 in | 4′ 0″ | 121.9 cm |
| 60 in | 5′ 0″ | 152.4 cm |
| 64 in | 5′ 4″ | 162.6 cm |
| 69 in | 5′ 9″ | 175.3 cm |
| 72 in | 6′ 0″ | 182.9 cm |
For precise conversions in any direction, use our Height in Inches to CM Calculator or CM to Feet Calculator.
Height in Inches: What a “Normal” Range Actually Looks Like
“Average” and “normal” are not the same thing. Growth charts show that healthy children span a wide range of heights at every age.
Take a 10-year-old boy as an example. CDC data shows:
- 5th percentile: ~49.5 inches
- 25th percentile: ~52.5 inches
- 50th percentile (average): ~55.0 inches
- 75th percentile: ~57.5 inches
- 95th percentile: ~60.0 inches
That is a span of more than 10 inches — all within the normal range. A child at either extreme is not necessarily experiencing a growth problem.
What pediatricians actually watch for:
- Falling off a percentile curve: A child who was consistently at the 60th percentile dropping to the 15th over 12 months
- Growth velocity stopping: No measurable gain over a 6-month period during childhood
- Extreme outliers: Below the 3rd percentile or above the 97th percentile, combined with other symptoms
Plot your child’s measurements against the CDC and WHO percentile charts to see their individual growth curve, not just a single data point.
Height in Inches List: Key Milestones at a Glance
If you want a fast-reference list of the most commonly searched height milestones expressed in inches:
- Height at birth: ~19.4–19.7 inches
- Height in inches at 1 year: ~29–30 inches
- Height in inches at 2 years: ~34–35 inches
- Height in inches at 4 years: ~40–41 inches
- Height in inches at 5 years: ~43–44 inches
- Height in inches at 10 years: ~54–55 inches
- Height in inches at 12 years: ~59–60 inches
- Average height in inches for men: 69.2 inches (5′ 9″)
- Average height in inches for women: 64.3 inches (5′ 4″)
Factors That Influence Your Height at Every Age
Average height in inches by age is a reference point — not a destiny. These are the variables that actually determine where any individual lands:
Genetics (~80% of Variance)
Genetics is the single biggest predictor of adult height. The mid-parental height formula gives a rough estimate:
- Boys: (Father’s height + Mother’s height + 5 inches) ÷ 2
- Girls: (Father’s height + Mother’s height − 5 inches) ÷ 2
This estimate is accurate within ±2 inches for most people.
Nutrition
Protein, calcium, vitamin D, and zinc are the four nutrients most directly tied to bone growth. Undernutrition during childhood — particularly during the first 1,000 days of life — can reduce final adult height by 4–6 inches in severe cases. UNICEF research links chronic undernutrition to stunted growth in millions of children globally.
Sleep
Growth hormone is released primarily during deep sleep. Children who consistently get inadequate sleep may experience reduced growth velocity. The CDC recommends 9–12 hours of sleep per night for school-age children and 8–10 hours for teens.
Hormonal Health
Growth hormone deficiency (GHD) and hypothyroidism are the two most common medical causes of short stature. Both are treatable when identified early. Delayed puberty can compress the growth window for boys, while precocious puberty in girls can close growth plates early.
Physical Activity
Weight-bearing exercise stimulates bone density but does not directly add height. There is no credible evidence that specific exercises increase height once growth plates are open. Proper posture, however, can add a perceptible half-inch to your measured height by reducing spinal compression.
How to Read Height in Inches: Practical Examples
Here is what common height measurements mean in real terms — helpful if you are measuring a child or converting a number from another format:
- “My child is 44 inches” → That is 3′ 8″, which is right on target for an average 5-year-old.
- “The doctor said she’s 54 inches” → That is 4′ 6″, typical for a 10-year-old girl.
- “I’m 69 inches” → That is 5′ 9″ — exactly the U.S. average for adult men.
- “His height is 1.75 m” → That is 68.9 inches, or 5′ 8.9″.
Need to make sense of a measurement you received? Use our Feet to CM Calculator or Inches to Feet Calculator to translate any number instantly.
When to Talk to a Doctor About Height
A height measurement outside the charts is not automatically a problem. But these situations call for a pediatrician’s evaluation:
- Height falls below the 3rd percentile or above the 97th percentile
- A child drops more than 2 percentile lines between regular check-ups
- No growth is detected over a 6-month period during active childhood years
- A child’s height is significantly out of sync with family history
- An adult loses more than 2 inches from their peak height
Early intervention matters. Growth hormone therapy, nutritional corrections, and addressing underlying conditions are most effective when started before the growth plates close.
Frequently Asked Questions
What is the average height in inches for a 5-year-old?
The average height for a 5-year-old is approximately 43–44 inches (roughly 3 feet 7–8 inches) for both boys and girls. Most healthy 5-year-olds fall between 40 and 47 inches. A reading outside that range is worth discussing with a pediatrician, especially if it represents a change from previous measurements.
What is the average height in inches for an adult man in the United States?
According to CDC NHANES data, the average height for U.S. adult men is 69.2 inches (5 feet 9 inches). This figure is based on measured height, not self-reported data, which tends to run slightly higher due to rounding up.
At what age do boys stop growing in inches?
Most boys stop growing in height between ages 17 and 18, once their growth plates close. A small number continue adding a marginal amount through age 20–21. The peak growth spurt for boys typically occurs between ages 13 and 14.
How many inches does a child grow per year on average?
During childhood (ages 4–10), children typically grow 2–2.5 inches per year. Growth accelerates during puberty (up to 3–4 inches per year for boys, 3–3.5 inches for girls) and then slows to zero once growth plates close.
What does height in inches mean exactly?
Height in inches is simply your total standing height expressed in the imperial unit of inches, rather than feet-and-inches or centimeters. One inch equals 2.54 cm. A person who is 5 feet 4 inches tall has a height in inches of 64 (5 × 12 + 4 = 64). This format is commonly used on medical forms, growth charts, and sports physicals in the United States.
Is 60 inches tall for a 12-year-old?
60 inches (5 feet) is close to average for a 12-year-old of either sex. The median height at age 12 is approximately 59.5 inches for both boys and girls. A reading of 60 inches puts a 12-year-old right at the 50th percentile — exactly average.
Measure, Then Convert Instantly
Got a height reading and need to make sense of it in another unit?
- Height in Inches Calculator — Convert between inches, cm, feet, and meters
- CM to Feet Calculator — Translate any centimeter measurement to feet and inches
- Feet to CM Calculator — Go the other direction
- Inches to CM Calculator — Total inches to centimeters
- Average Height Charts — Boys, girls, men, and women by country
- Height Charts by Percentile — Plot your child’s growth curve